Brent Crude Oil: general analysis
04 January 2018, 10:21
| Scenario | |
|---|---|
| Timeframe | Intraday |
| Recommendation | BUY STOP |
| Entry Point | 68.00 |
| Take Profit | 68.75 |
| Stop Loss | 67.75 |
| Key Levels | 65.62, 66.40, 67.18, 67.96, 68.75 |
| Alternative scenario | |
|---|---|
| Recommendation | SELL STOP |
| Entry Point | 67.10 |
| Take Profit | 66.40, 65.62 |
| Stop Loss | 67.40 |
| Key Levels | 65.62, 66.40, 67.18, 67.96, 68.75 |
Current trend
Oil prices are growing.
Yesterday Brent went up by 2.40% and reached the level of 67.96, which is last 3-years maximum. The instrument is supported by preliminary API Crude Oil Stocks change data, which reflect the decrease of the resources by 4.992 million barrel in a week. EIA Crude Oil Stocks change release is due at 17:30 (GMT+2) today. If the data confirms the decrease, Brent will be significantly supported.
The growth of the prices is supported by tense situation in Iran, where anti-Government protests are expressed all over the country.
Support and resistance
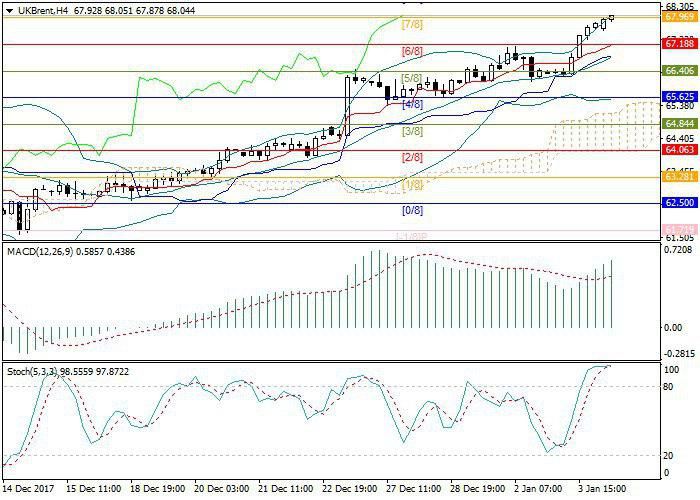
Technical indicators reflect the maintenance of the upward trend, but the technical correction possibility is not excluded.
Bollinger Bands are pointed upwards. MACD volumes are growing in the positive zone, forming a buy signal. Stochastic is in the overbought zone, which can reflect the reversal of the price.
The instrument is now testing the level of 67.96 (Murray [7/8]). If it cannot consolidate above this level, the correction to the levels of 67.18 (Murray [6/8]), 66.76 (the middle line of Bollinger Bands) is possible.
The breakout of the level 67.96 will let the price grow to the level of 68.75 (Murray [8/8]).
Resistance levels: 67.96, 68.75.
Support levels: 67.18, 66.40, 65.62.

Trading tips
Long positions can be opened above the level of 67.96 with the target at around 68.75 and stop loss 67.75.
Short positions can be opened below the level of 67.18 with the targets at around 66.40–65.62 and stop loss 67.40.
Oil prices are growing.
Yesterday Brent went up by 2.40% and reached the level of 67.96, which is last 3-years maximum. The instrument is supported by preliminary API Crude Oil Stocks change data, which reflect the decrease of the resources by 4.992 million barrel in a week. EIA Crude Oil Stocks change release is due at 17:30 (GMT+2) today. If the data confirms the decrease, Brent will be significantly supported.
The growth of the prices is supported by tense situation in Iran, where anti-Government protests are expressed all over the country.
Support and resistance
Technical indicators reflect the maintenance of the upward trend, but the technical correction possibility is not excluded.
Bollinger Bands are pointed upwards. MACD volumes are growing in the positive zone, forming a buy signal. Stochastic is in the overbought zone, which can reflect the reversal of the price.
The instrument is now testing the level of 67.96 (Murray [7/8]). If it cannot consolidate above this level, the correction to the levels of 67.18 (Murray [6/8]), 66.76 (the middle line of Bollinger Bands) is possible.
The breakout of the level 67.96 will let the price grow to the level of 68.75 (Murray [8/8]).
Resistance levels: 67.96, 68.75.
Support levels: 67.18, 66.40, 65.62.

Trading tips
Long positions can be opened above the level of 67.96 with the target at around 68.75 and stop loss 67.75.
Short positions can be opened below the level of 67.18 with the targets at around 66.40–65.62 and stop loss 67.40.
0 Response to "Brent Crude Oil: general analysis 04 January 2018, 10:21"
Post a Comment